Advertisement

Special Series: J.D. Power & Associates – Discount Brokerage Rankings Data Visualized
Blog
December 10, 2012
Table Of Contents
Key points
How to use the Visual Discount Brokerage Rankings Table We’ve collected the results from the J.D. Power and Associates Investor Satisfaction survey from 2012 (Table 1) as well as historical results from 2009-2012 (Table 2). To help visualize how the different discount brokerages have performed on the surveys relative to other discount brokerages, we’ve created […]
How to use the Visual Discount Brokerage Rankings Table
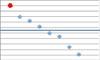
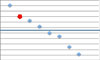
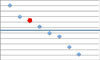
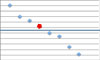
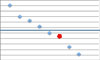
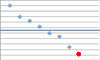
We’ve collected the results from the J.D. Power and Associates Investor Satisfaction survey from 2012 (Table 1) as well as historical results from 2009-2012 (Table 2). To help visualize how the different discount brokerages have performed on the surveys relative to other discount brokerages, we’ve created small graphs called “sparxlines”. Each graph shows a series of dots that represent the order in which a company ranked according to the survey results and ordered from left to right (with 1st being on the far left). A red dot on each graph corresponds to the company referenced in the same row. The average for the industry is presented on the graph for a point of reference to identify which companies are at, above or below average. Lastly the scores are provided for a numerical reference point. To find out more about a particular discount brokerage, simply click on the logo of the company to be taken to the brokerage profile.
Table 1: J.D. Power and Associates 2012 Investor Satisfaction Results
| Sparxline | Company | Investor Satisfaction Survey Score | Rating |
|---|---|---|---|
 |
768 | 5/5 | |
 |
720 | 4/5 | |
 |
719 | 4/5 | |
 |
707 | 3/5 | |
 |
690 | 3/5 | |
 |
687 | 3/5 | |
 |
686 | 3/5 | |
 |
686 | 3/5 | |
 |
 |
678 | 3/5 |
 |
656 | 2/5 |
Source: J.D. Power and Associates 2012 Discount Brokerage Investor Satisfaction Study
Table 2: Average J.D. Power and Associates Investor Satisfaction Results (2009-2012)
| Sparxline | Company | Average Score |
|---|---|---|
 |
741 | |
 |
720 | |
 |
713 | |
 |
702 | |
 |
690 | |
 |
684 | |
 |
665 | |
 |
652 |
Sources:
- J.D. Power and Associates 2012 Discount Brokerage Investor Satisfaction Study
- J.D. Power and Associates 2011 Discount Brokerage Investor Satisfaction Study
- J.D. Power and Associates 2010 Discount Brokerage Investor Satisfaction Study
- J.D. Power and Associates 2009 Discount Brokerage Investor Satisfaction Study
Note:
Companies listed in this table have at least 3 years of results to use in calculating an average. Companies excluded because of insufficient data were Qtrade, HSBC InvestDirect and Credential Direct.
Look Back / Look Ahead: A Review of Canadian Online Brokerages in 2021 & Preview of 2022
Blog
December 31, 2021If you thought 2021 was an eventful year (and it was!) at Canada’s online brokerages, wait until you see what’s in store for 2022. In this milestone issue of the Look Back / Look Ahead series, we hear from leaders at Canadian online brokerages about what they saw as the biggest highlights, as well as what they’re working on to impress self-directed investors in the next year. Also, we’ve got the scoop on four new online brokerages moving into the commission-free trading game.
Read More >
Mark to Market: The “Limit Buy” Part 2
Blog
February 25, 2021Welcome to part 2 of Mark to Market, the comic where we break down complicated market concepts into easy to understand comics. In part 1 of this chapter, Mark Tradewell, a fictional DIY investor, decided to invest some of his funds in his Tax Free Savings Account into shares of the ABC company. When he […]
Read More >

©2022 SparxTrading.com, property of
Sparx Publishing Group Inc.
All Rights Reserved.